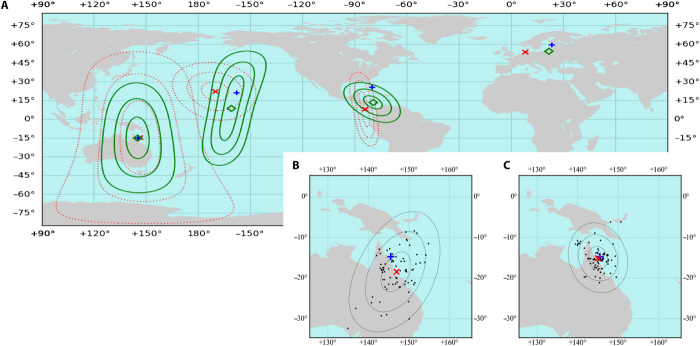
Fig. 3. Maps of position estimates.
(A) World map of all position estimates. The blue pluses show the locations of the measurement sites, the red exes and dotted contour lines show the centroid and distribution of position estimates using just the single-scattering model for inference, and the green diamond and contours show the centroid and distribution of position estimates using the kNN method. The contours are at 1, 2, and 3 SDs from the centroid. Too few data were collected in Finland to estimate the SD contours. (B and C) Maps of position estimates from data taken at the Lizard Island Research Station when the Sun was at least 40° above the horizon, using only the single-scattering model (B) or the kNN method (C). The blue pluses show the location of the collection site, black dots are individual position estimates, and the red exes show the mean position estimate. The concentric curves are at 1, 2, and 3 SDs from the mean.

