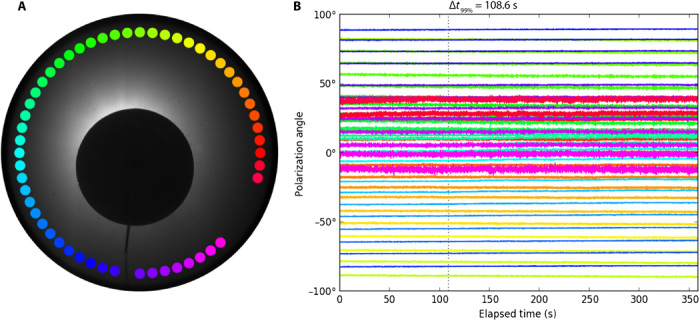
Fig. 4. Example sensitivity data.

(A) Intensity image taken during a sensitivity experiment performed during the morning. The camera is set vertically, with a disc to block the Sun. The colored circles around the periphery show the regions over which the polarization angles are measured. Regions with partial polarization less than 5% were rejected. (B) Polarization angles measured during the sensitivity experiment; colors correspond to the regions shown in (A). The polarization angles vary almost linearly at the time of day the data were recorded. The vertical dotted line shows how long it takes the angles to change with 99% confidence.
