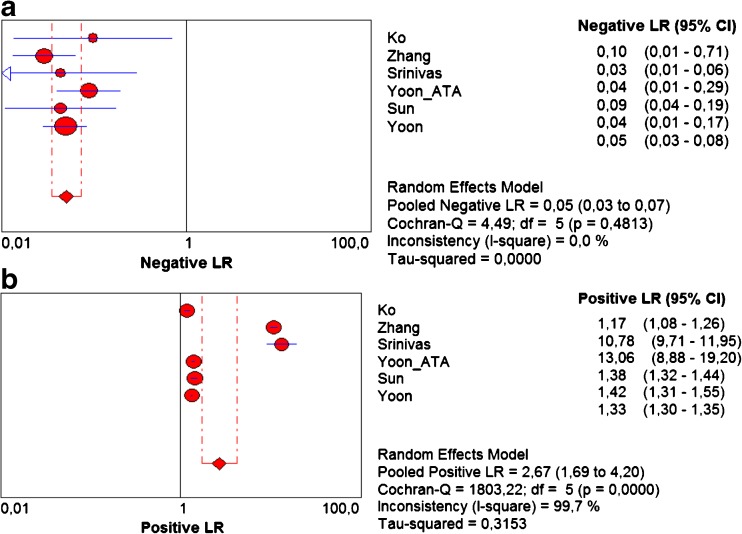
Fig. 5.
Forest plots of eligible studies showing individual and pooled (A) negative and (B) positive likelihood ratios (LRs) of Kwak’s TIRADS in the differential diagnosis of thyroid nodules. Pooled values indicated by diamonds with 95 % confidence intervals (in brackets). TIRADS Thyroid Image Reporting and Data System

