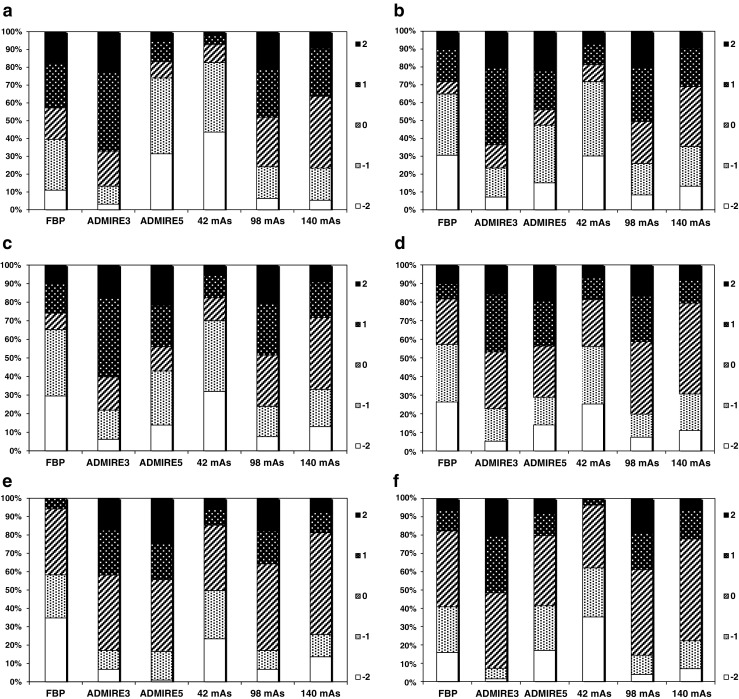
Fig. 2.

The bars show the percentage of scores assigned to the current image type when compared to other image types. Score 2 indicates that the current image type was rated as superior to the alternative, score 1 that it was rated as probably superior to the alternative, score 0 that the alternatives were rated as equivalent, score –1 that the current image type was rated as probably inferior to the alternative, and score –2 that it was rated as inferior to the alternative. a (C1) Favourable versus (vs.) unfavourable scores for image quality criterion 1: Visually sharp reproduction of the liver parenchyma. b (C2) Favourable vs. unfavourable scores for image quality criterion 2: Visually sharp reproduction of pancreas contour. c (C3) Favourable vs. unfavourable scores for image quality criterion 3: Visually sharp reproduction of contours of the kidneys & proximal ureters. d (C4) Favourable vs. unfavourable scores for image quality criterion 4: Visually sharp reproduction of the contours of the lymph nodes < 15mm. e (C5) Favourable vs. unfavourable scores for image quality criterion 5: Image noise not affecting interpretation. f (C6) Favourable vs. unfavourable scores for image quality criterion 6: Overall image quality for diagnostic purposes
