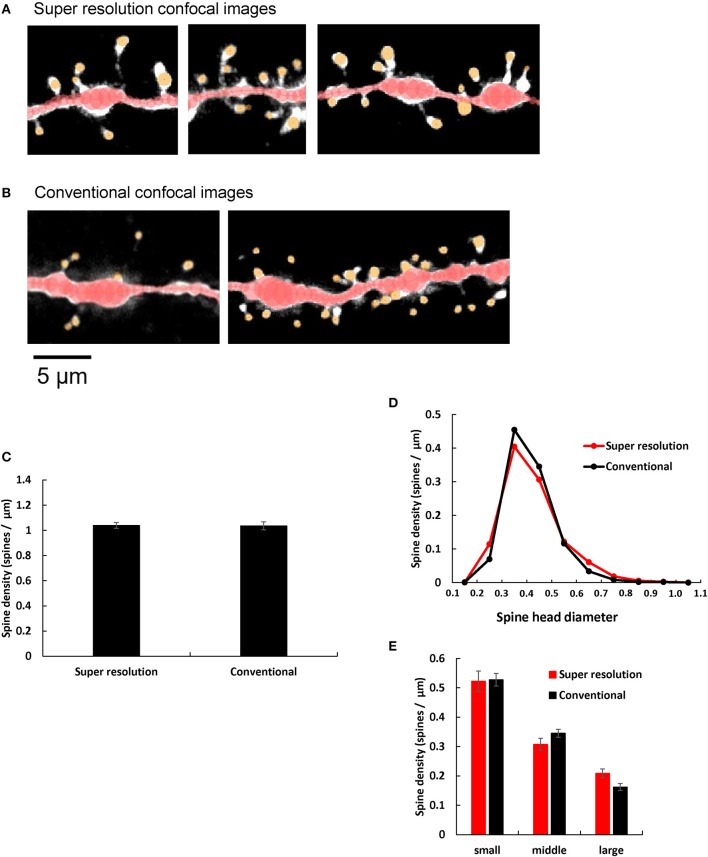
Figure 4.
Comparison of spine images obtained by super resolution confocal microscopy and conventional confocal microscopy. (A,B) Typical dendrites with spines of CA1 neurons are shown after analysis with Spiso-3D software. Maximal intensity projections onto XY plane are shown. Traced dendrites are shown in red color and spines are indicated in yellow color. Images are obtained with (A) Super resolution confocal microscopy and (B) Conventional confocal microscopy. Bar, 5 μm. (C) Comparison of the total spine density of control dendrites (without steroid supplementation) obtained with super resolution confocal microscopy (Super resolution) and Conventional confocal microscopy (Conventional). Vertical axis is the average number of spines per 1 μm of dendrite. (D) Histogram of spine head diameters of control. Super resolution (red line), and Conventional (black line). (E) Density of three subtypes of spines of control dendrites. From left to right, small-head spines (small), middle-head spines (middle), and large-head spines (large). In each group, Super resolution (red column), and Conventional (black column). Abbreviations are same as in (C). Results are represented as mean ± SEM. No statistical significance was observed. For Super resolution, we investigated 80 dendrites with ~4,000 spines, 6 rats, 24 slices, and 50 neurons. For Conventional, we used 40 dendrites with ~2,000 spines from 4 rats, 10 slices, and 21 neurons.

