Figure 5.
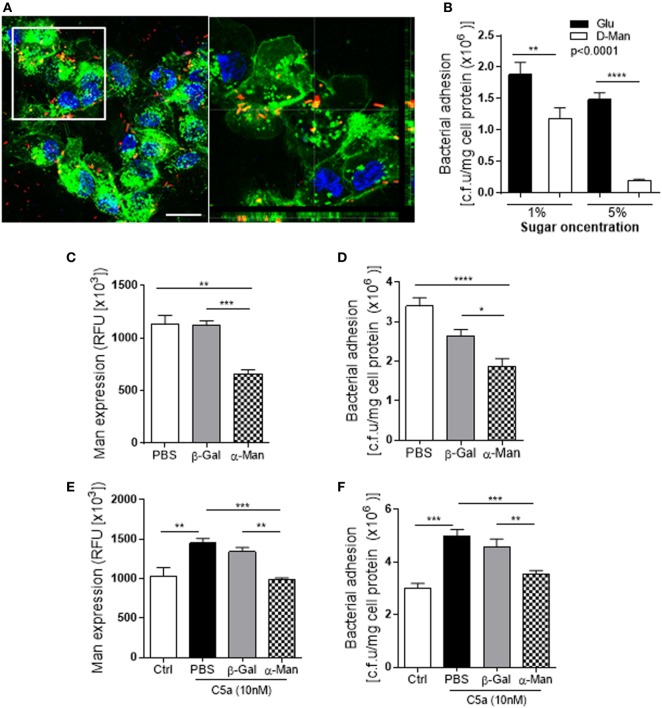
Uropathogenic Escherichia coli adhesion to renal tubular epithelial cell (RTEC) through binding to Man on the cell surface of the RTEC. (A) Confocal microscopic images of bound bacteria in RTEC (non-permeabilized) that had been incubated with labeled J96 for 1 h. Bacteria (red), Man (green) detected by fluorescein-labeled Galanthus nivalis lectin and 4’,6-diamidino-2-phenylindole (blue) are shown. Left image: compressed image. Scale bars, 10 µm. Right image: corresponding to the boxed region in the left image show the cross-sectional views in z stack (bottom and side panel) of RTEC, Man, and bacteria, demonstrating association of Man and J96 at cell surface of RTEC. (B) Bacteria binding to RTEC, evacuated by bacterial plate count assay. RTEC were incubated with d-mannose or glucose (1 or 5%) for 30 min before the addition of bacteria. Data were analyzed by two-way ANOVA with multiple comparisons (n = 8 individual wells per group). (C,E) Man expression in RTCE that had been pre-treated without C5a (C) or with C5a (E) for 24 h and then treated with buffer alone (PBS) or containing α-mannosidase (5 mM) or control enzyme (β-galactosidase) for 1 h, evacuated by fluorescence intensity-based microplate assay. Data were analyzed by one-way ANOVA with Tukey’s multiple comparisons (n = 6 individual wells per group). (D,F) Bacterial binding to RTEC that had undergone the same treatments as described in (C,E), evacuated by bacterial plate count assay. (D) Without C5a pre-treatment. (F) With C5a pre-treatment. Data were analyzed by one-way ANOVA with Tukey’s multiple comparisons (n = 8 individual wells per group). *P < 0.05, **P < 0.01, ***P < 0.001, ****P < 0.0001. All results shown are representative of three independent experiments.

