Figure 7.
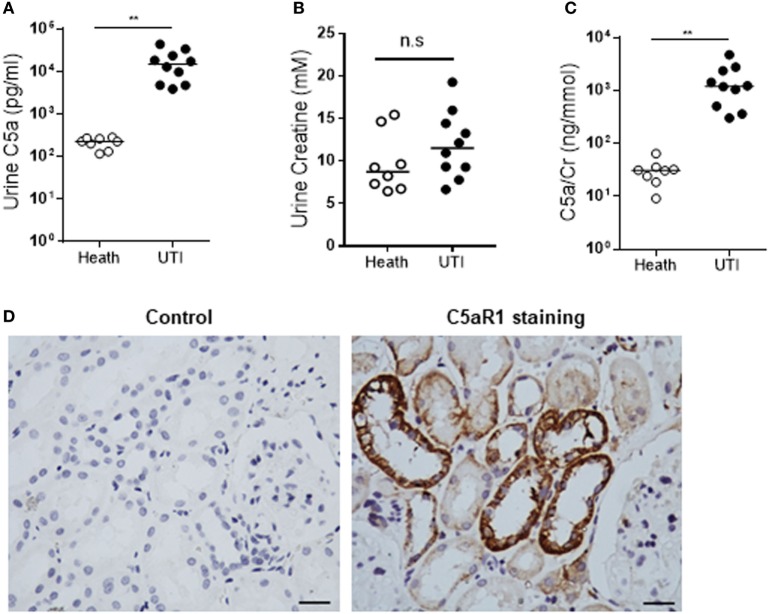
Detection of C5a and C5aR1 in human urinary tract. (A–C) C5a and creatinine concentrations in urine from urinary tract infection (UTI) patients and healthy controls. (A) Urinary C5a concentrations. (B) Urinary creatinine concentrations. (C) Ratios of urinary C5a/creatinine concentration. Data were analyzed by Mann–Whitney U two-tailed test. **P < 0.01, n.s. no significant. (D) C5aR1 expression in human kidney tissue determined by immunochemical staining. Control: negative control, tissue stained with non-specific mouse IgG2a. Scale bar, 50 µm.

