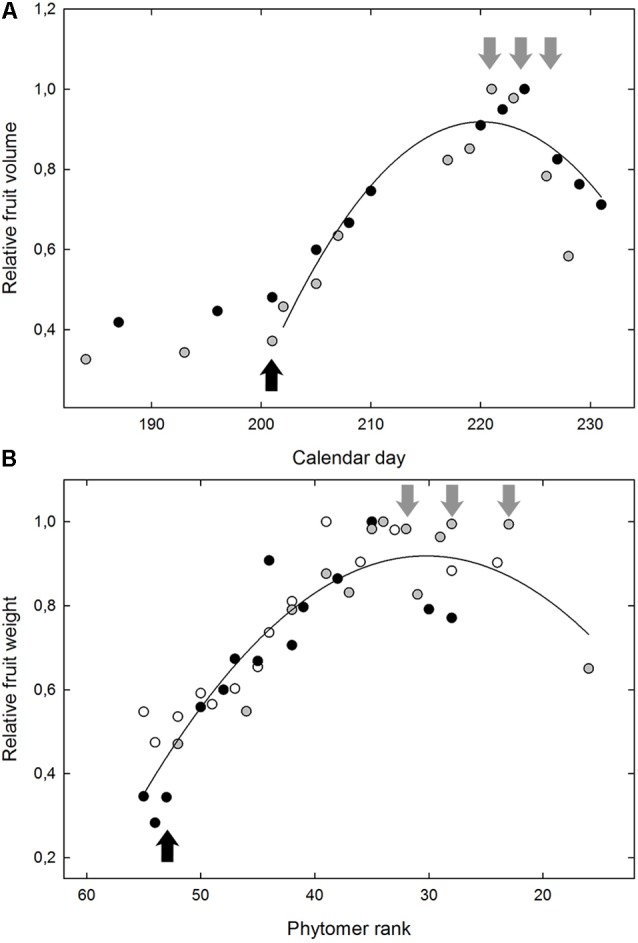
FIGURE 2.

The typical fruit growth from onset of ripening for the Grenache variety (A) in Experiment 2 and for the microvine offspring n°114 (B) in Experiment 4. In (A), the data correspond to the evolution of the relative fruit volume, as a function of the calendar day, with the maximum berry volume as 1. The average berry volume was non-destructively monitored by the immersion of 2 reference clusters (gray and black dots). In (B), the relative berry weight is represented for 3 replicate plants of the microvine n°114 (gray, black, and white dots) as a function of the phytomer position from the base of the main shoot, with the maximum average berry weight as 1. Black arrows indicate the date/position of the samples for green berry. Gray arrows indicate the 3 dates/positions of the samples analyzed for ripe berries.
