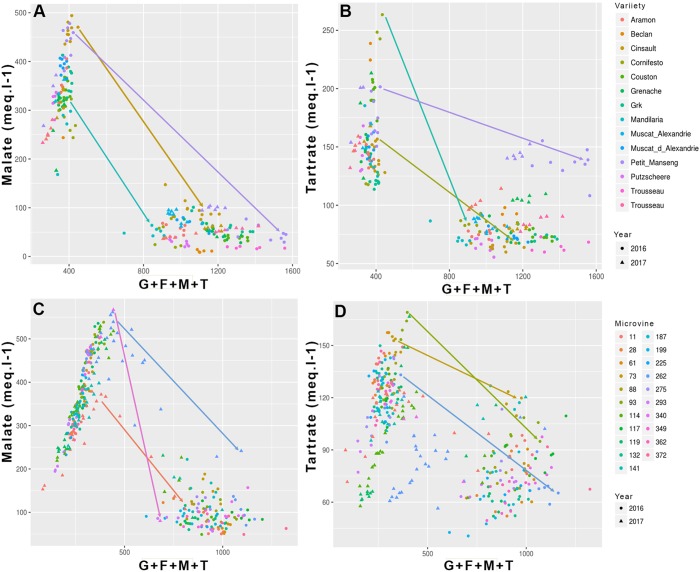
FIGURE 3.
Evolution of the main acids (malic and tartaric) concentration as a function of sum of major osmoticum (glucose + fructose + malate + tartrate) concentration during ripening for variety (A,B) and microvine (C,D) subsets. Arrows show several contrasted trends for the evolution of malate and tartrate concentrations from the onset of ripening to ripe stage.

