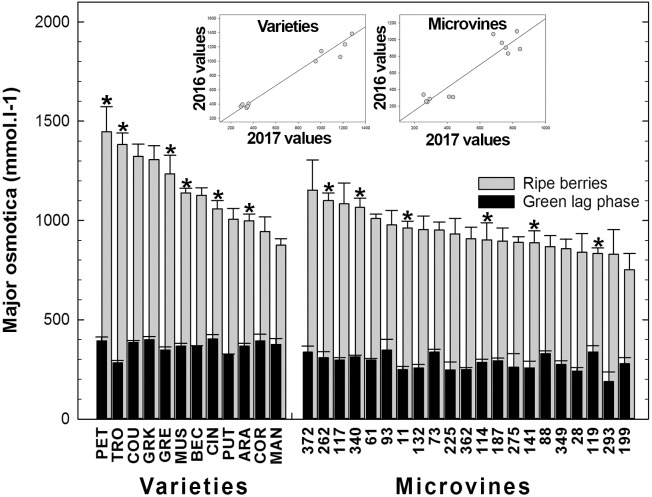
FIGURE 8.
Diversity in the sum of major fruit osmotica (glucose, fructose, malic and tartaric acids) concentrations at the end of green growth and at ripe stage in varieties and microvine subsets. Bar chart represent 2016 mean values with the corresponding SE. Contrasted genotypes experimented in 2016 and 2017 are indicated by an asterisk. Inserted plots show the relationships between the mean values of both years (Supplementary Tables S3, S4 for detailed numeric values and statistics).

