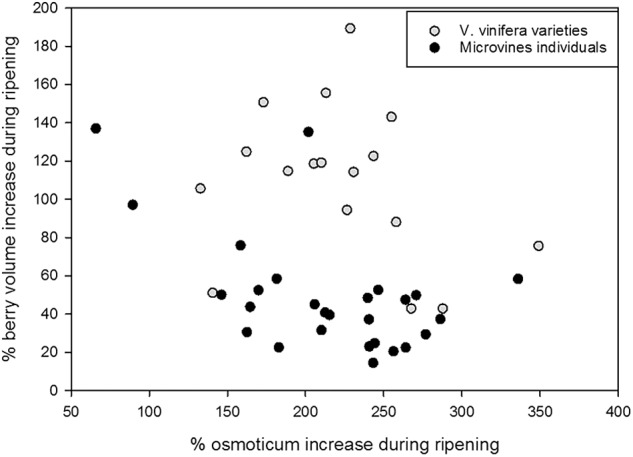
FIGURE 9.

Major osmoticum concentration and fruit volume changes during ripening in varieties (grey dots) and microvine (black dots) subsets. % of osmoticum increase is calculated as 100∗(osmoticum contents at max berry growth stage – osmoticum contents in green hard berry)/osmoticum contents in green hard berry. % of berry volume increase is calculated as 100∗(berry volume at max berry growth stage – berry volume of green hard berry)/berry volume of green hard berry.
