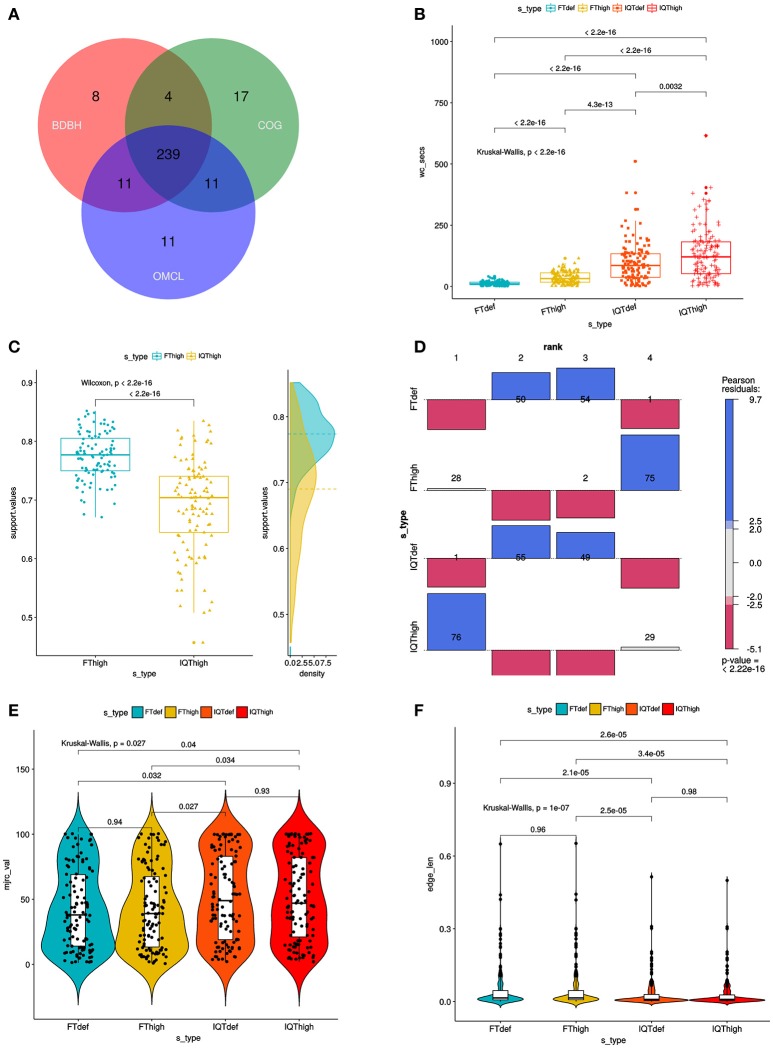
Figure 3.
Combined filtering actions performed by GET_HOMOLOGUES and GET_PHYLOMARKERS to select top-ranking phylogenetic markers to be concatenated for phylogenomic analyses, and benchmark results of the performance of the FastTree (FT) and IQ-TREE (IQT) maximum-likelihood (ML) phylogeny inference programs. (A) Venn-diagram indicating the number consensus and algorithm-specific core-genome orthologous clusters. (B) Parallel box-plots summarizing the computation time required by FT and IQT when run under “default” (FTdef, IQTdef) and thorough (FThigh, IQThigh) search modes (s_type) on the 239 consensus clusters, as detailed in the main text. Statistical significance of differences between treatments were computed with the Kruskal-Wallis (robust, non-parametric, ANOVA-like) test. (C) Distribution of SH-alrt branch support values of gene-trees found by the FThigh and IQThigh searches. Statistical significance of differences between the paired samples was computed with the Wilcoxon signed-rank test. This is a non-parametric alternative to paired t-test used to compare paired data when they are not normally distributed. (D) Association plot (computed with the vcd package) summarizing the results of multi-way Chi-Square analyses of the lnL score ranks (1–4, meaning best to worst) of the ML gene-trees computed from the set of 105 codon alignments passing the kdetrees filter in the IQThigh run (Table 2) for each search-type. The height and color-shading of the bars indicate the magnitude and significance level of the Pearson residuals. (E) Statistical analysis (Kruskal-Wallis test) of the distribution of consensus values from majority-rule consensus trees computed from the gene trees passing all the filters, as a function of search-type. (F) Statistical analysis (Kruskal-Wallis test) of the distribution of the edge-lengths of species-trees computed from the concatenated top-scoring markers, as a function of search-type.

