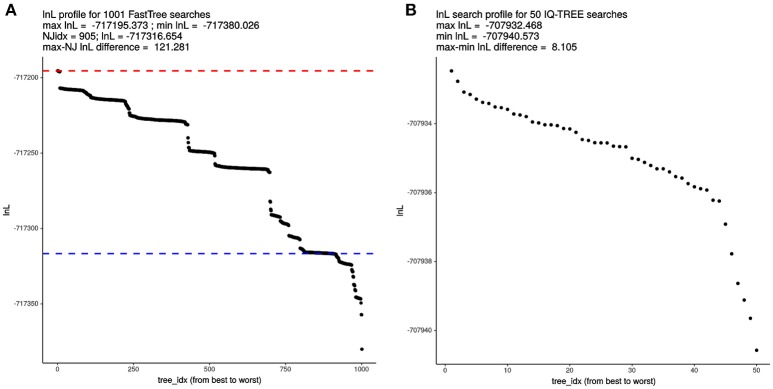
Figure 4.
Comparative analysis of log-likelihood tree search profiles. (A) Sorted lnL profile of FastTree (FT) tree searches launched from 1,000 random trees + 1 BioNJ phylogeny, using the “thorough” tree-search settings described in the main text and the 55 top-ranking markers (26,988 non-gapped, variable sites) selected by the IQThigh run for 119 genomes (Table 2). The dashed blue line indicates the score of the search initiated from the BioNJ tree. (B) Sorted lnL profile of 50 independently launched IQ-TREE (IQT) searches under the best-fitting model using the same matrix as for the FT search.

