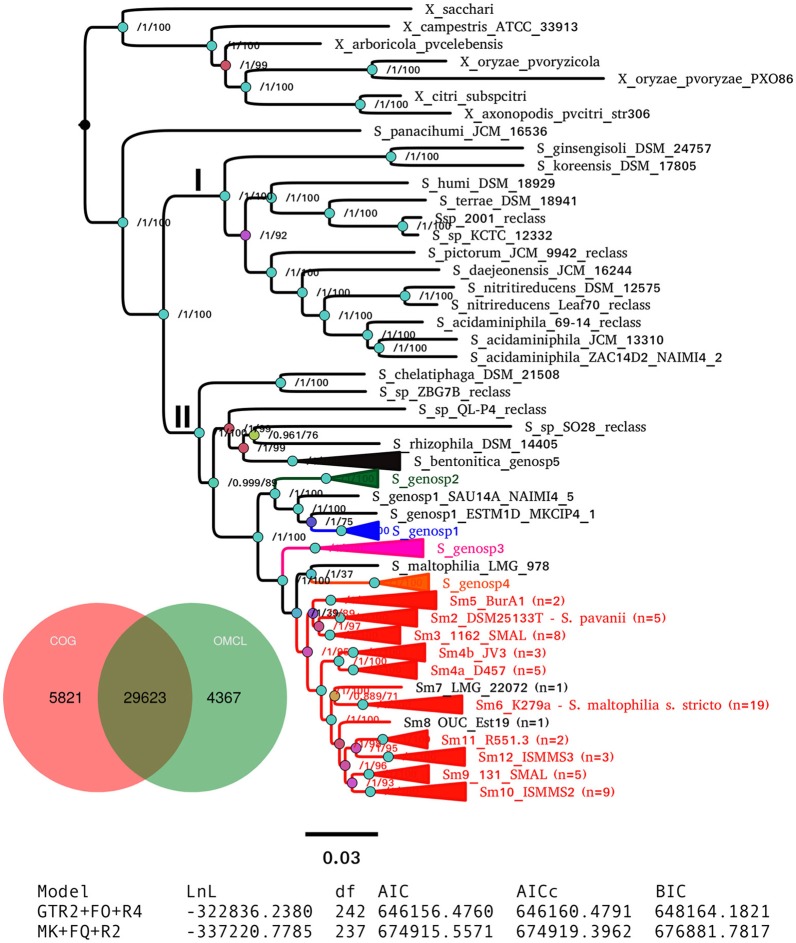
Figure 6.
Maximum-likelihood pan-genome phylogeny estimated with IQ-TREE from the consensus pan-genome clusters displayed in the Venn diagram. Clades of lineages belonging to the S. maltophilia complex are collapsed and are labeled as in Figure 5. Numbers on the internal nodes represent the approximate Bayesian posterior probability/UFBoot2 bipartition support values (see methods). The tabular inset shows the results of fitting either the binary (GTR2) or morphological (MK) models implemented in IQ-TREE, indicating that the former has an overwhelmingly better fit. The scale bar represents the number of expected substitutions per site under the binary GTR2+F0+R4 substitution model.

