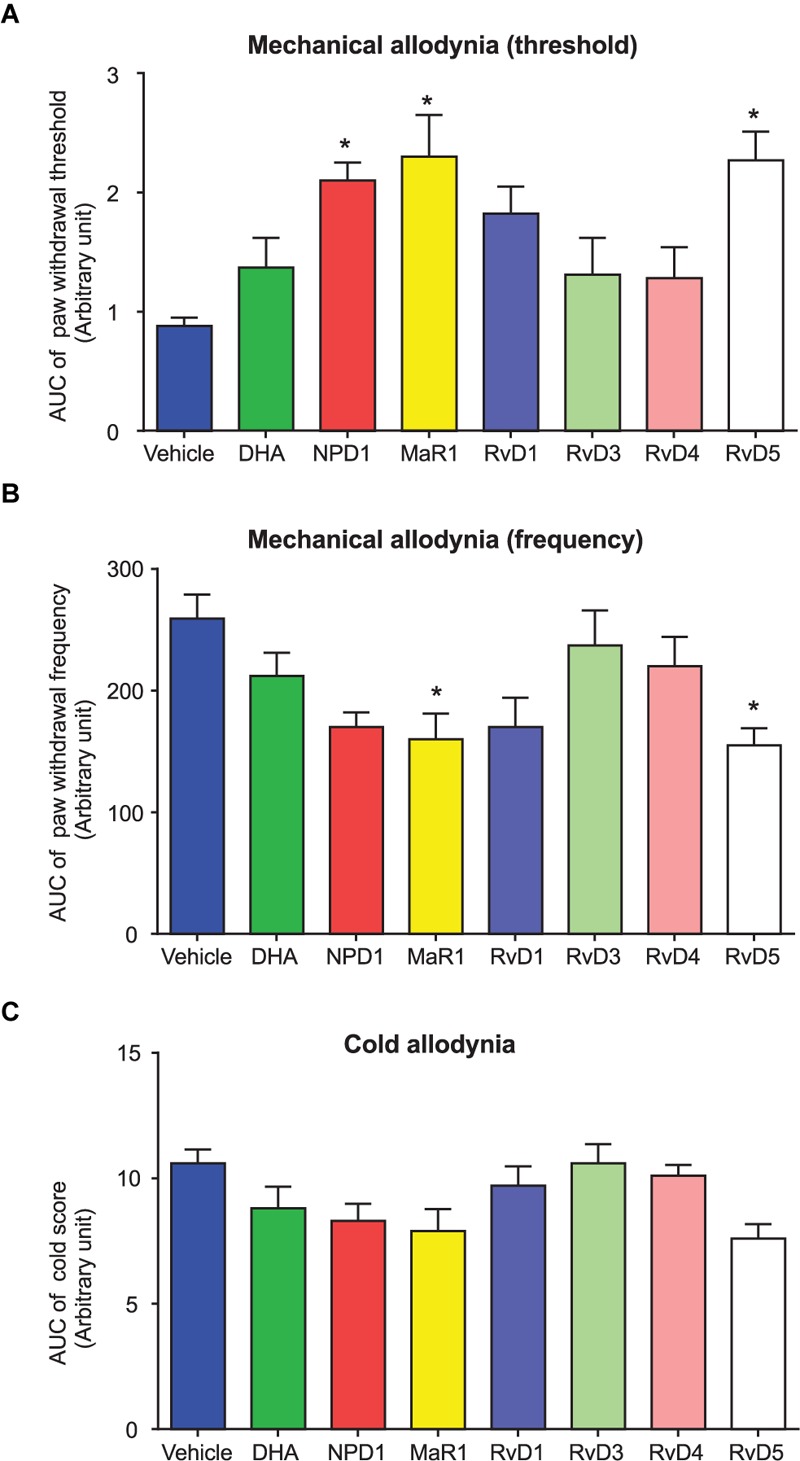
FIGURE 5.

Area under curve (AUC) comparison of distinct post-treatment effects of DHA and DHA-derived SPMs on fPOP. (A–C) AUC showing the effects of post-surgical IT treatment of DHA (500 μg, 10 μl) and NPD1, MaR1, RvD1, RvD3, RvD4, and RvD5 (500 ng, 10 μl), given 2 weeks after bone fracture surgery on mechanical and cold allodynia. AUC data were collected at 1–5 h after the drug injection. ∗P < 0.05 vs. vehicle (10% ethanol), two-way ANOVA followed by Bonferroni test, n = 5–7 mice/group. Data are presented as mean ± SEM.
