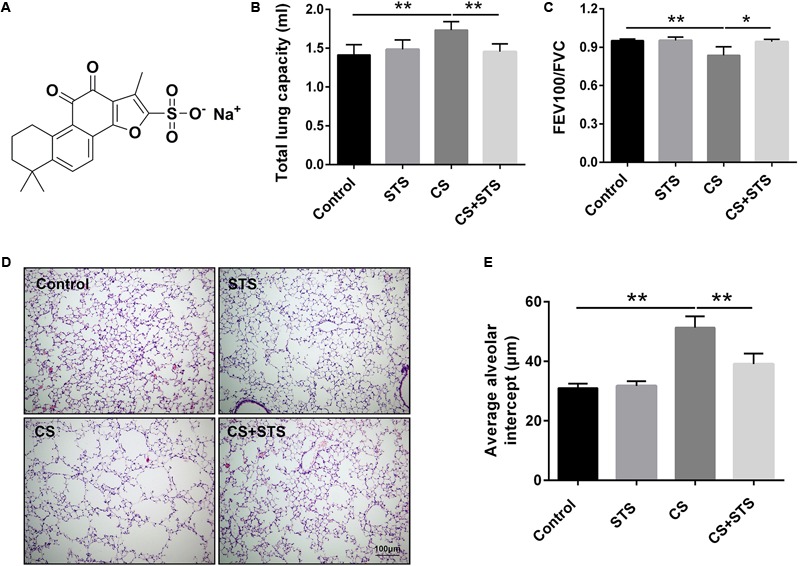
FIGURE 1.

STS ameliorated cigarette smoke (CS)-induced COPD in mice. (A) Chemical structure of STS. (B,C) 3 months after CS inhalation, lung function parameters including total lung capacity and FEV100/FVC among different groups were calculated. (D) Lung pathology was determined by H&E staining. Scale bars = 100 μm. (E) Average alveolar intercept, representing the degree of emphysema was quantified by Image Pro Plus 6.0 software. Data are expressed as mean ± SEM, n = 6, ∗P < 0.05; ∗∗P < 0.01.
