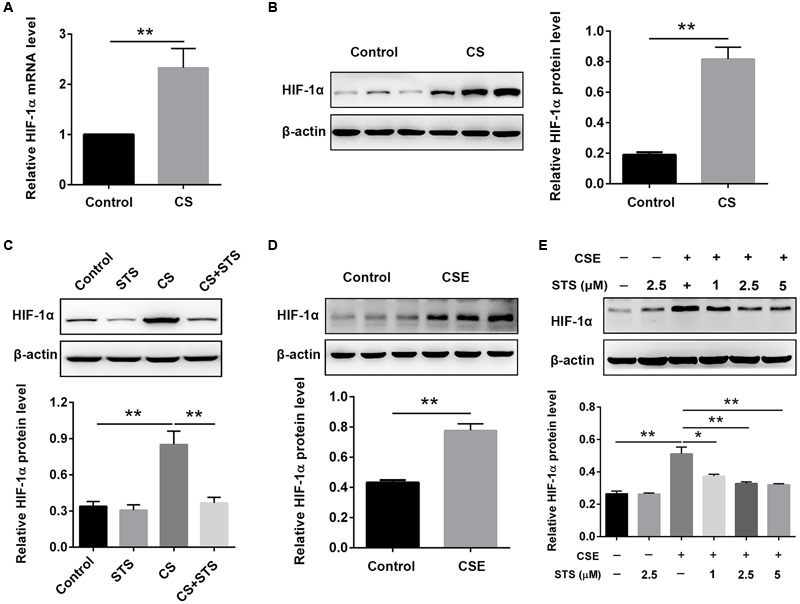
FIGURE 5.

STS suppressed CS-induced HIF-1α expression in the lungs and in macrophages. (A–C) 3 months after CS inhalation, lung tissues were collected and prepared for RT-PCR and Western blot analysis using antibodies against HIF-1α and β-actin. Data are presented as mean ± SEM, n = 6, ∗∗P < 0.01. (D,E) Macrophages were treated with CSE and different concentrations of STS (1, 2.5, and 5 μM) for 24 h. Cells were then collected and prepared for Western blot analysis using antibodies against HIF-1α and β-actin. Data are presented as mean ± SEM, n = 3, ∗P < 0.05; ∗∗P < 0.01.
