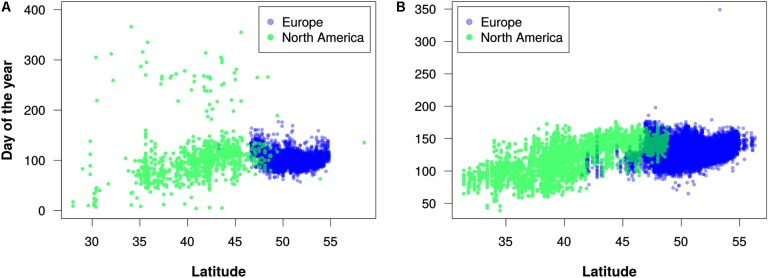
FIGURE 5.
Latitudinal trends in flowering times for (A) maples (Acer) in the 2010s and (B) lilacs (Syringa) in the 1960s. Each dot represents the earliest estimated flowering time for a 0.1°-by-0.1° geographic grid cell. These decades were chosen because they had more even distribution of records between North America and Europe in comparison to other decades with available data. Note that these graphs are intended merely to demonstrate the utility of the PPO for large-scale data integration and analysis; they should not be construed as robust phenological analyses.

