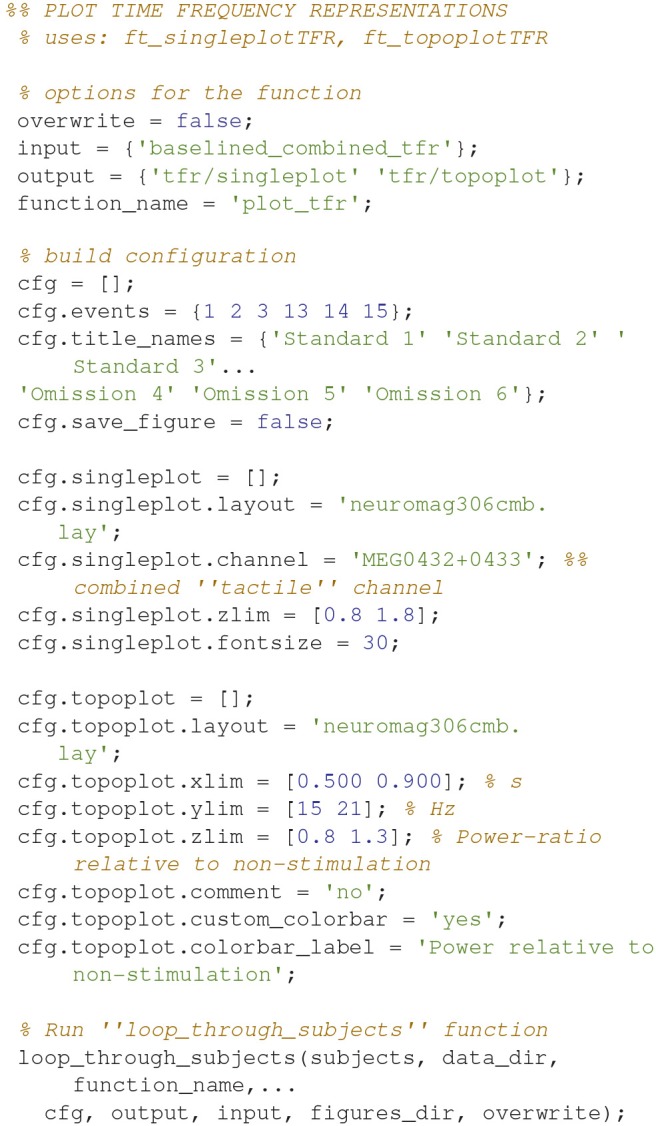
Code Snippet 12.

Example code for creating plots of single sensors (not shown here) and topographies (Figure 7) for time-frequency representations. Creating and saving plots for each subject is also done with loop_through_subjects.

Example code for creating plots of single sensors (not shown here) and topographies (Figure 7) for time-frequency representations. Creating and saving plots for each subject is also done with loop_through_subjects.