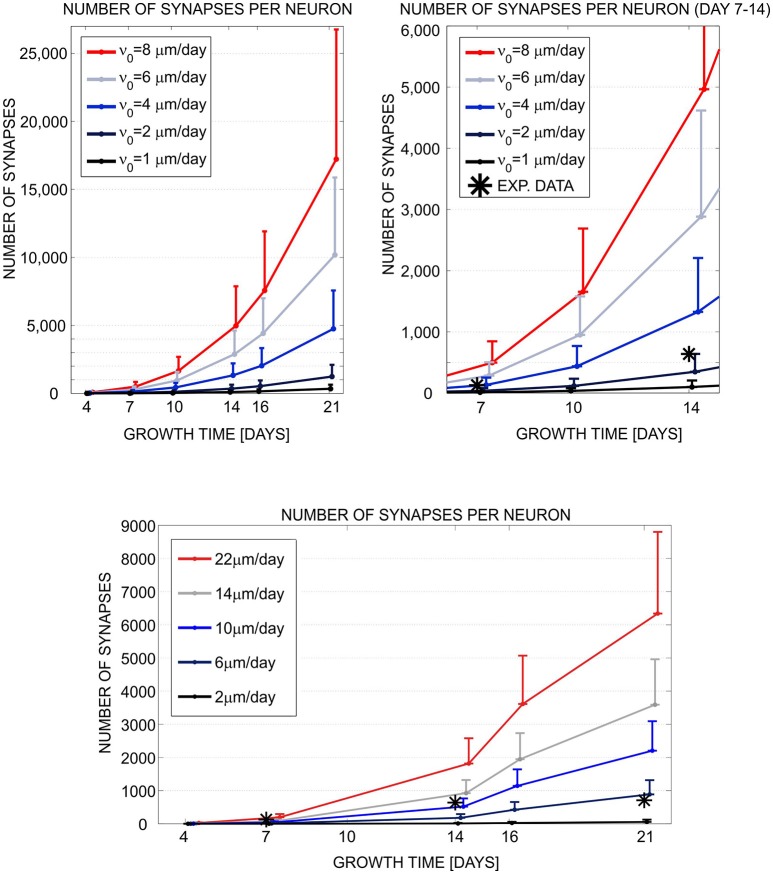
Figure 1.
Evaluation and comparison of the neuronal growth simulation tools (NETMORPH and Cortex3D). Panels illustrate the increase in synapse counts during simulation time equivalent to 4–21 days in vitro. The number and position of somata were fixed. For each neuron, the neurites grew according to the implemented model and formed synaptic contacts based on proximity between axonal and dendritic branches. In this figure, we varied one of the parameters that controlled neurite growth, the elongation rate ν0 (see legend), and different colors correspond to different parameter values. The results show mean (line) and standard deviation (bar) for the number of synapses per neuron, averaged over all neurons in the culture. Stars indicate experimental values extracted from the literature (Ichikawa et al., 1993). (Top left) Synapse counts obtained from NETMORPH, elongation rates equal to 1, 2, 4, 6, and 8 μm/day. (Top right) Zoomed interval 7–14 days from the panel (Top left). (Bottom) Synapse counts obtained from Cortex3D, elongation rates equal to 2, 6, 10, 14, and 22 μm/day. x axis—growth time in days, y axis—number of synapses per neuron. For days 4–14 and ν0 = 2μm/day (NETMORPH) or ν0 = 10μm/day (Cortex3D), the simulated values corresponded to the experimental ones. After 14 days the simulated values increased while the experimental values saturated as no synaptic pruning was implemented in this test. The neurite growth was slower for Cortex3D which was visible from the values for ν0. Reproduced from Aćimović et al. (2011) with permission from Hindawi.

