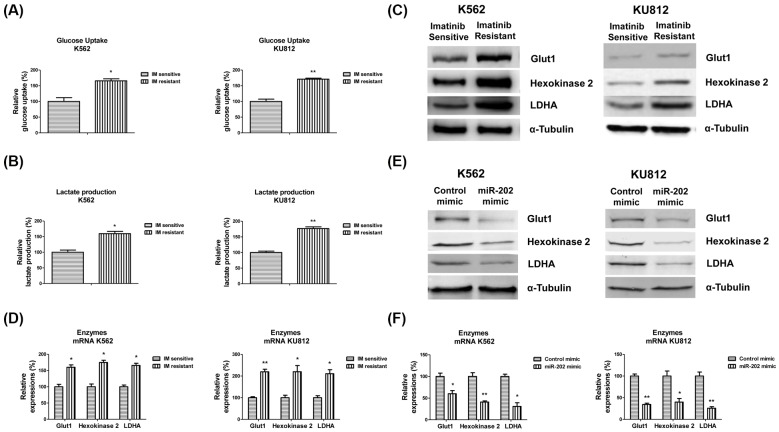
Figure 3. Glycolysis is up-regulated in K562 imatinib resistant cells.
(A) Glucose uptake and (B) lactate production were measured in K562 or KU812 imatinib sensitive and resistant cells. (C) The protein and (D) mRNA expressions of glycolysis enzymes Glut1, HK2, and LDHA were measured in K562 or KU812 imatinib sensitive and resistant cells. (E) K562 and KU812 were transfected with control mimic or miR-202 mimic for 48 h, the protein and (F) mRNA expressions of glycolysis enzymes Glut1, HK2, and LDHA were measured. α-Tubulin is a loading control. The results are presented as mean ± S.D. of triplicates from each of three independent experiments. *P <0.05; **P <0.01.

