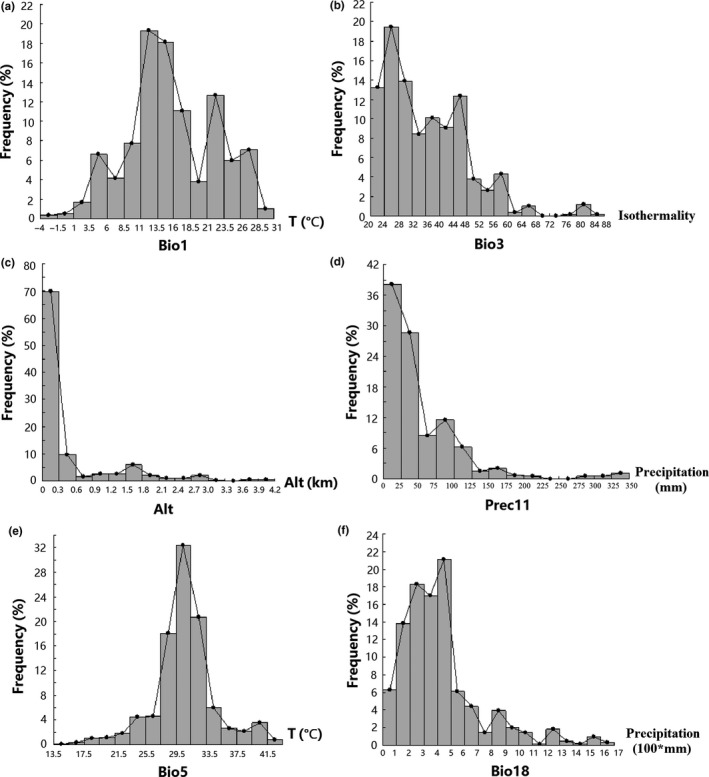
Figure 4.

Frequency distribution of six environment variables with contribution rates with a relatively high contribution rate. (a) Annual mean temperature (°C). (b) Isothermality (BIO2/BIO7 × 100). (c) Altitude (m). (d) November precipitation (mm). (e) Maximum temperature of warmest month (°C). (f) Precipitation of warmest quarter (mm)
