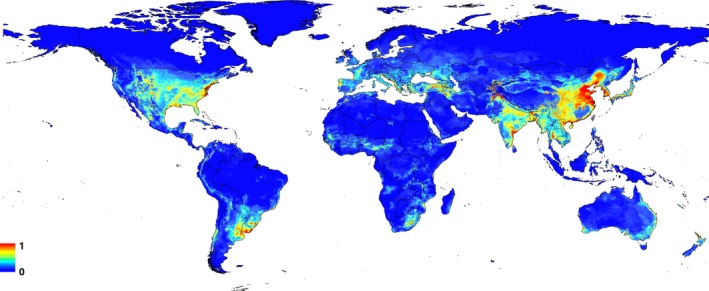
Figure 5.

Predicted potential geographic distributions for CPV‐2 in the world. Color scale indicates the probability that conditions are the risk level for CPV‐2: red = high‐risk probability, green = average‐risk probability, blue = low‐risk probability
