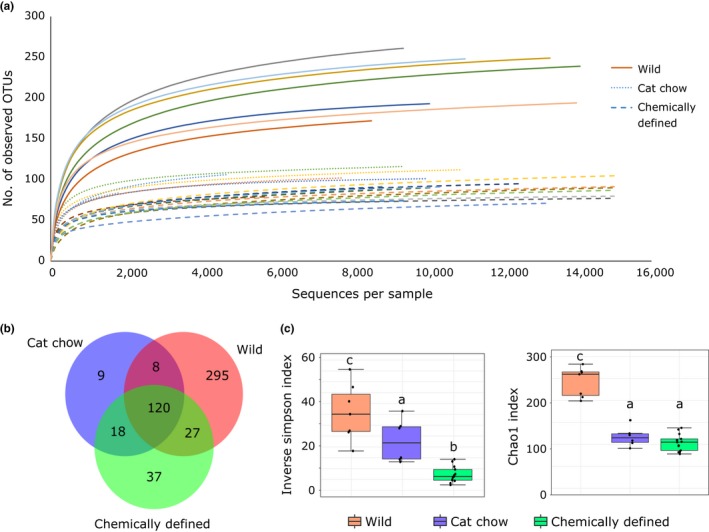
Figure 2.

Diversity of gut microbiota in crickets. (a) Rarefaction curves of 16S rRNA genes from 26 crickets. (b) Venn diagram depicting the distribution of the total 514 operational taxonomic units (OTUs) identified. Wild crickets (n = 7) have more unique OTUs than laboratory‐reared crickets fed cat chow (n = 6) or chemically defined diets (n = 13). (c) Alpha diversity indices, inverse Simpson's index (left panel), and Chao1 index indicate that wild crickets have greater diversity in their gut bacterial communities. Boxes cover the interquartile range (IQR) and the line inside the box denotes the median. Whiskers represent the lowest and highest values within 1.5 × IQR. Analysis of variance (ANOVA): inverse Simpson's index—F(2,23) = 26.52, p < .0001; Chao1 index—F(2,23) = 77.21, p < .0001. Different small letters signify significant differences in Tukey's honest significant difference (HSD) post hoc tests
