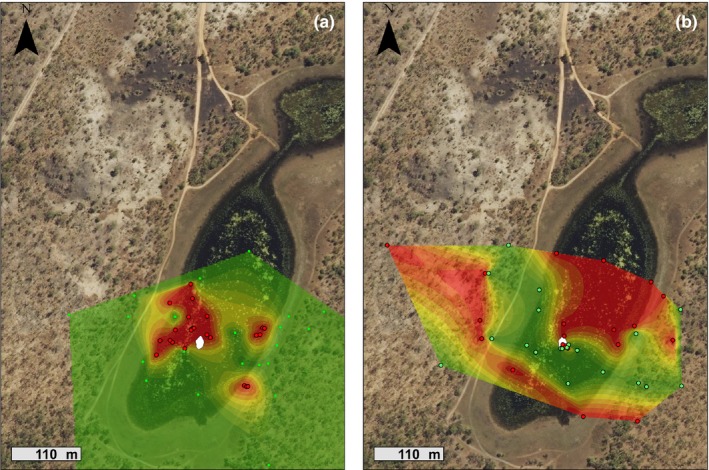
Figure 6.

Heat map of the study site comparing diurnal refugia locations of infected and dewormed cane toads. Under dry conditions (a), infected toads (red points) used refugia closer to the remaining area of water than did dewormed toads (green points). After a period of heavy rain (b), infected toads used refugia further away from the waterbody. The small central white area shows the extent of the waterbody at the time of the study
