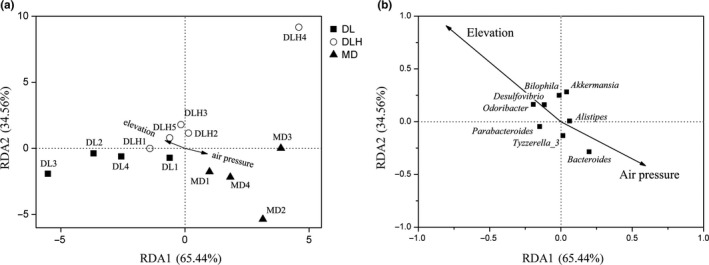
Figure 7.

Biplot of redundancy analysis (RDA) of intestinal microbiota samples from the lizard Phrynocephalus vlangalii responding to environmental factors. As temperature and air pressure were significantly autocorrelated, the model retained just air pressure and elevation. The white circles represent samples from DLH, the black boxes represent samples from DL, and the black triangles represent samples from MD (a). The black boxes represent the intestinal microbiota at genus level and only those genera with relative abundance greater than 0.5% were shown (b)
