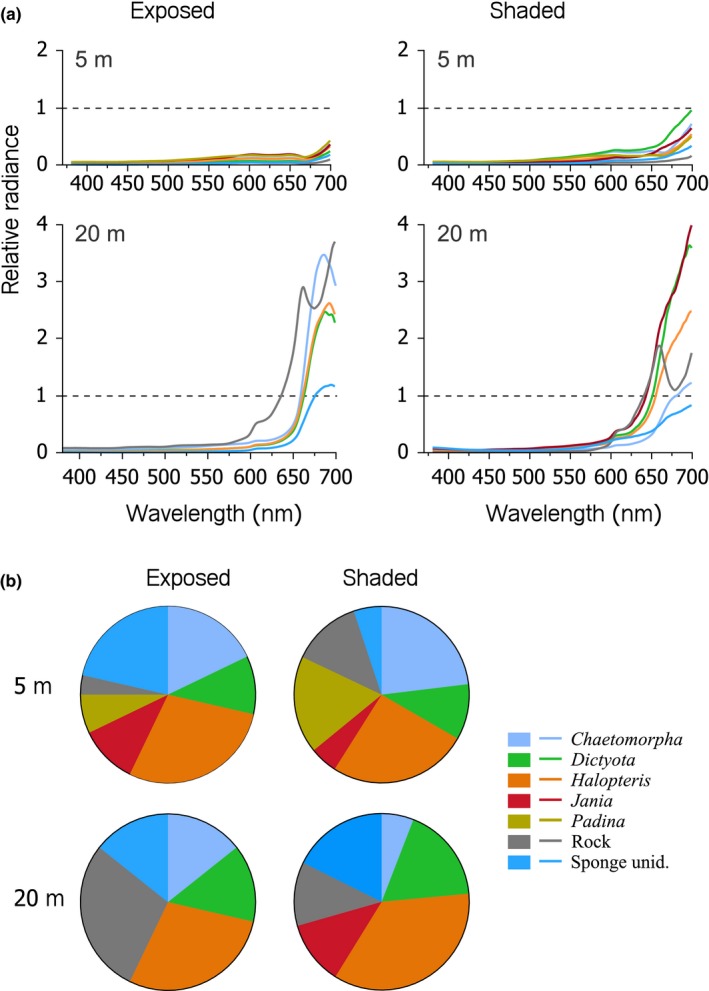
Figure 3.

(a) Line plots showing mean relative radiance (prop.) of typical Tripterygion delaisi substrate types as a function of wavelength at 5 and 20 m depth (rows) under sun‐exposed and shaded conditions (columns). Values exceeding 1 (black dashed line, referring to the radiance of the exposed diffuse white standard) indicate substrates that emitted more light at a specific wavelength than was available in the light spectrum, a typical signature of strong fluorescence. (b) Pie charts showing relative abundance of substrate types measured at each combination of depth and exposure. For a detailed species list, see Appendix S1
