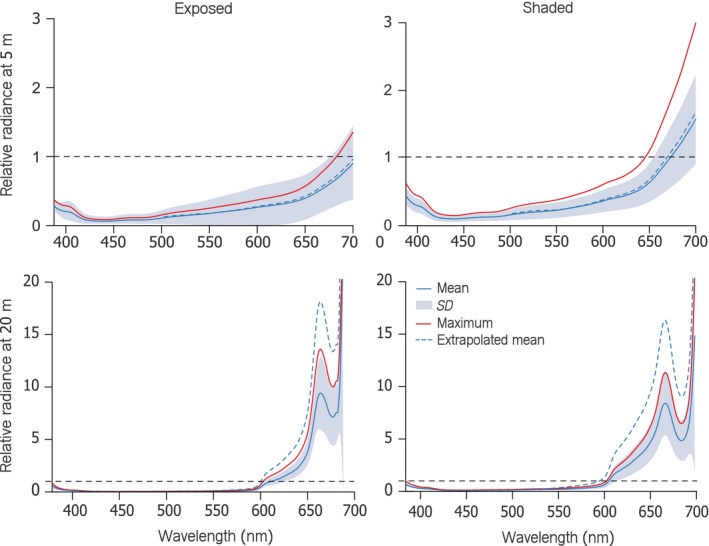
Figure 4.

Line plot showing iris relative radiance (prop.) of Tripterygion delaisi as a function of wavelength under exposed (left column) and shaded (right column) conditions at either 5 m (upper row) or 20 m depth (lower row). Blue lines represent means ± SD (shading) of all fish. Red lines indicate the maximum relative radiance averaged across individuals (n = 34). Values exceeding 1 (horizontal black dashed line) indicate that more photons were emitted by the fish iris at that wavelength than were available in the ambient spectrum, indicative of red fluorescence (assuming absence of specular reflection). The blue dashed curve shows the estimated brightness of the iris without clove oil anesthesia (see Methods)
