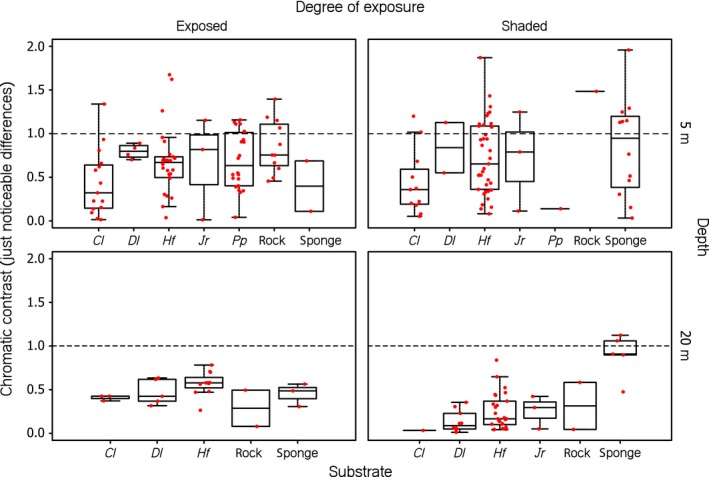
Figure 5.

Boxplots of chromatic contrasts between mean iris and mean substrate radiance per substrate type. Data points (in red) represent processed, individual measurements. The horizontal line in the graph indicates the threshold of color discrimination, set at 1 just‐noticeable difference (JND). Values above 1 indicate that a contrast is likely to be perceived by Tripterygion delaisi. The algal species covering the substrate are coded as follows: Cl, Chaetomorpha linum; Dl, Dictyota linearis; Hf, Halopteris filicina; Jr, Jania rubens; and Pf, Padina pavonia (see Appendix S1)
