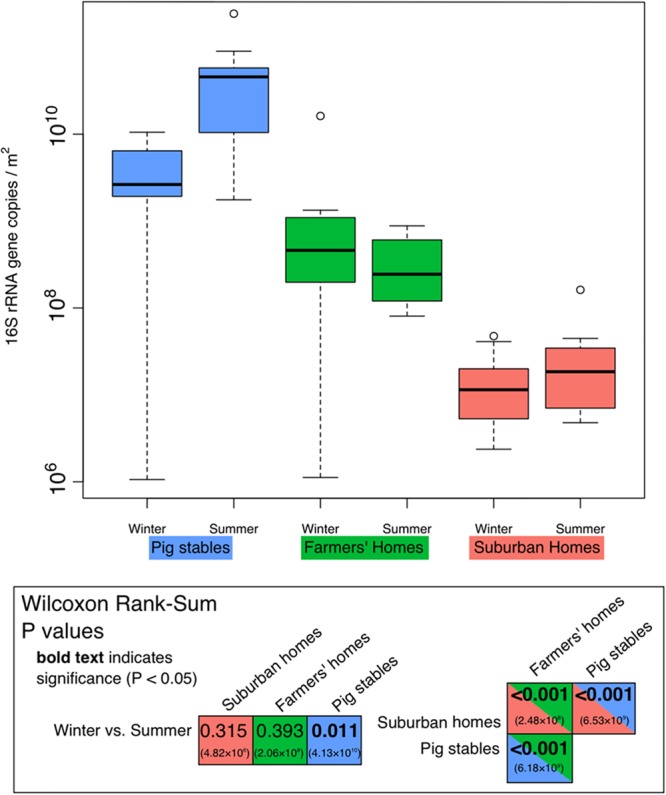
FIGURE 1.

Quantitative PCR measurements of the 16S rRNA genes in each environment type/season using bacteria-specific primers. Units are 16S rRNA gene copies per m2 of EDC (following 14 days of exposure). Each season/type box represents all 10 measurements made. Significance of the differences shown in this figure is demonstrated in the inset box containing results of the Wilcoxon rank sum test for various comparisons between seasons or environment types. P values in bold indicate values below 0.05 (significant). Values in parentheses are absolute values of Hodges–Lehmann estimators, showing the magnitude of the difference between the two sample types.
