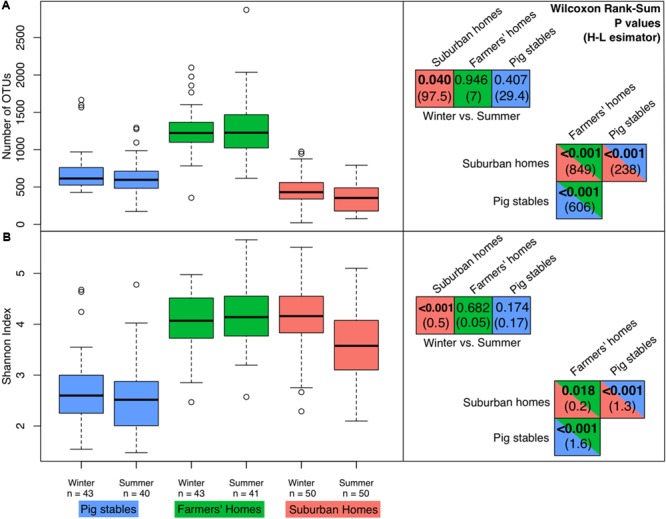
FIGURE 2.

Diversity measures in the different environment types/seasons. “n” indicates the numbers of samples for each environment type/season (technical replicates not included in this analysis). The right-hand panels show P values from Wilcoxon rank sum tests comparing richness/Shannon index in different environment types and seasons. Values in parentheses are absolute values of Hodges–Lehmann estimators, showing the magnitude of the difference between the two sample types. Bold P values are less than 0.05 (significant differences). (A) Boxplots of richness in terms of number of OTUs. (B) Boxplots of the Shannon index (taking into account both richness and evenness, with higher numbers indicating higher diversity).
