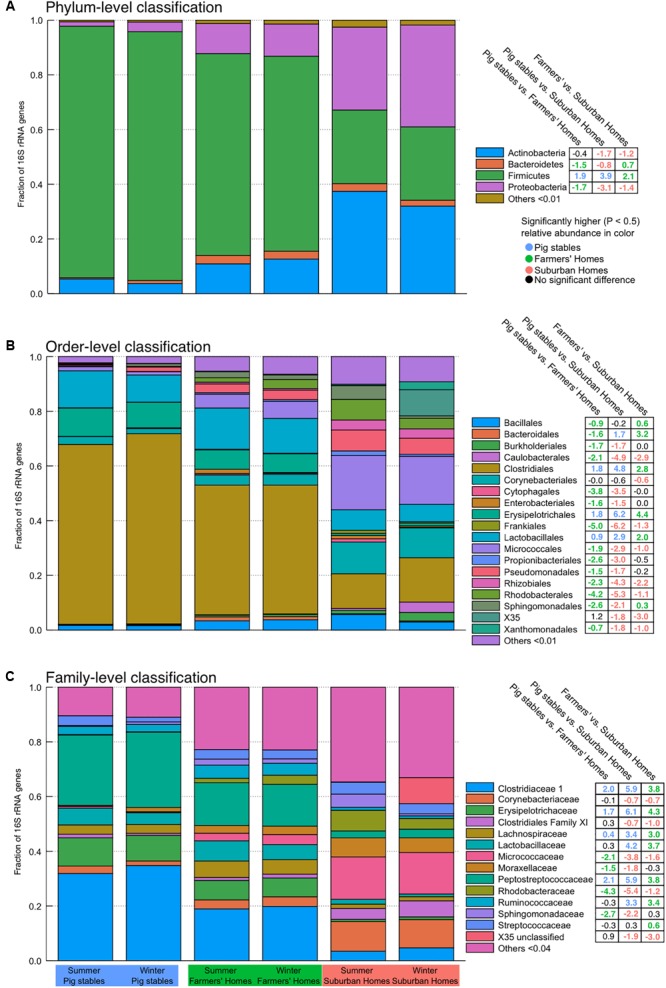
FIGURE 4.

Stacked bar plots indicating community-level composition at phylum (A), order (B), and family (C) levels. Abundances are weighted such that each sample contributes equally to the relative fraction illustrated. Values in the tables on the right-hand side are derived from the ALDEx2 analysis of differential abundance and show the median difference in centered log-ratio (clr) values for that particular taxon, illustrating the magnitude of the difference in abundance. Significant differences have colored text (colored according to the environment type) and non-significant differences have black text. Positive numbers mean the environment type listed before “vs.” contains a greater fraction of that particular taxon and negative numbers mean the environment type after “vs.” contains a greater fraction of that particular taxon.
