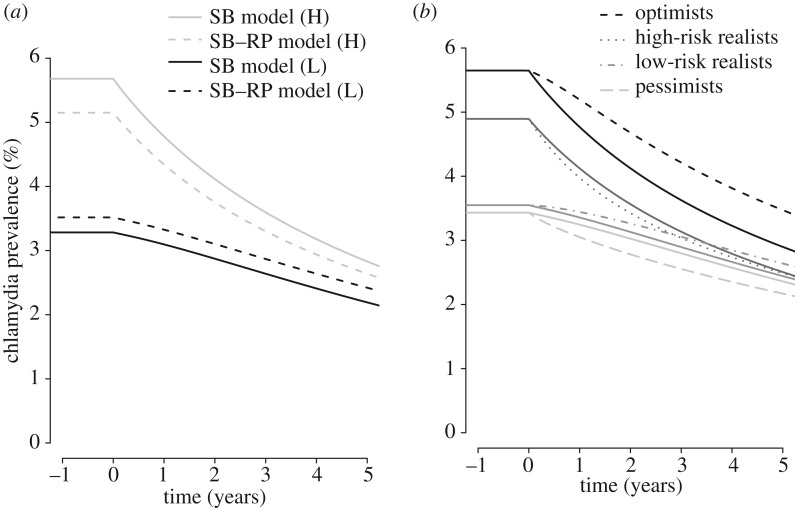
Figure 2.
Estimated chlamydia prevalence after the introduction of the baseline testing uptake scenario for five consecutive years. (a) The estimated chlamydia prevalence after the introduction of the baseline testing scenario; solid lines denote the model without incorporating risk perception (SB model) and dashed lines denote the model with risk perception (SB–RP model). (b) The estimated chlamydia prevalence in each group after the introduction of the baseline testing scenario (solid lines) and the testing scenario with differential uptake in SB–RP groups (dashed, dotted and dash-dot) in the SB–RP model.

