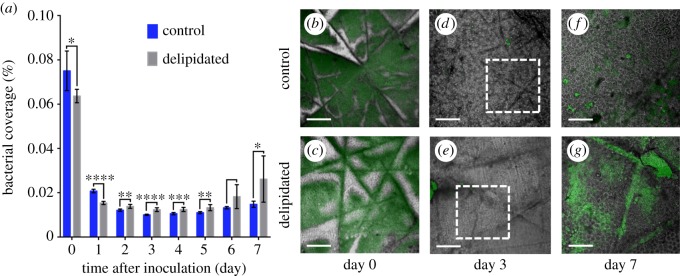
Figure 5.
Staphylococcus aureus coverage and spatially resolved growth varies with SC lipid content. (a) Average fractional bacterial coverage of the same regions of control (dark blue) and lipid-depleted (light grey) SC samples over time. Error bar denotes the mean ± s.d. of n = 2 SC samples per lipid condition (n = 8 regions per SC sample). Representative images of spatially resolved bacterial colonization and biofilm growth on (top row) control and (bottom row) delipidated SC samples over time. Images comprised a transmitted light image of SC overlaid with the fluorescent bacterial emission (green). (b,c) Bacterial growth 2 h post-inoculation (denoted day 0). Scale bar, 300 µm. (d,e) Microcolony formation 3 days post-inoculation. Scale bar, 300 µm. (f,g) Biofilm formation 7 days post-inoculation. These images, respectively, correspond to regions outlines in d and e. Scale bar, 150 µm.

