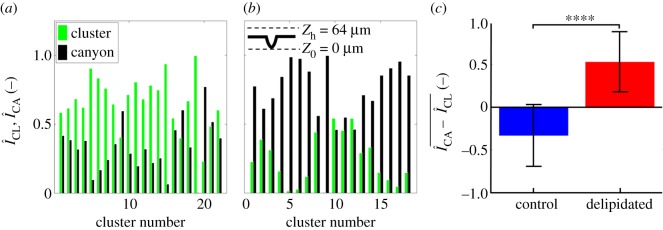
Figure 6.
Delipidation enables preferential S. aureus growth in and near microchannels. (a,b) Normalized fluorescent surface density of S. aureus in the topographical canyons ( black) and clusters (
 , green) of (a) control (b) delipidated SC. The schematic at the top of b describes the range over which fluorescent information is gathered. Here, Z0 denotes the bottom of the canyon, and Zh denotes the maximum height at which bacterial fluorescence is summed. (c) Averaged difference between canyon and cluster normalized fluorescent surface densities for control and delipidated SC. Error bars denote the mean ± s.d. between the samples (control) n = 22 assessments from n = 3 SC samples; (lipid depleted) n = 18 assessments from n = 3 SC samples.

