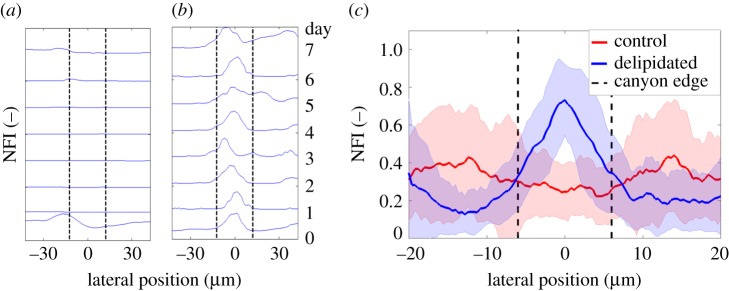
Figure 7.
Staphylococcus aureus biofilms preferentially grow within delipidated SC microchannels. (a,b) Normalized bacterial fluorescence intensity profiles across the same topographical canyon of (a) control and (b) delipidated SC over time. For each lipid condition, each profile is normalized by the peak fluorescent intensity over the 7 day cycle. (Vertical black dashed line) Edge of the topographical canyon. (c) Average normalized bacterial fluorescence profile across topographical canyons 7 days following S. aureus inoculation. (Red solid line) Control SC (n = 4 SC samples, n = 358 canyon profiles). (Blue dashed line) Delipidated SC (n = 4 SC samples, n = 408 canyon profiles). Shaded regions surrounding the lines denote the standard deviation. (Vertical black dashed lines) Average width of the topographical canyons.

