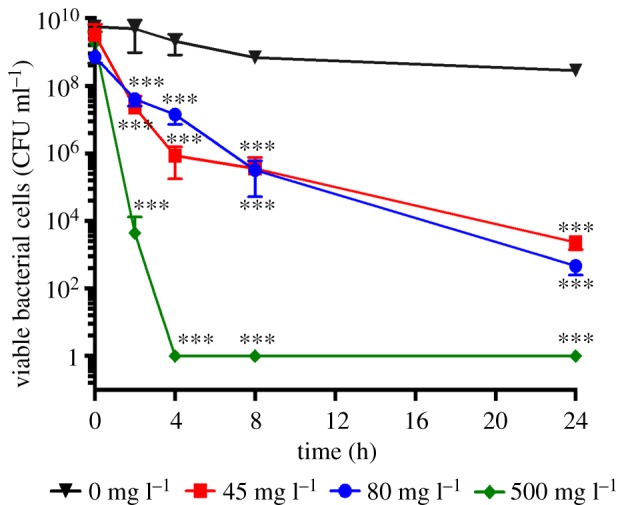
Figure 8.

Time–kill curves of S. aureus exposed to d-sphingosine. Average (n = 4) cell viability of S. aureus mid-exponential phase planktonic cultures in BHI exposed to (inverted triangle) 0 mg l−1, (square) 45 mg l−1, (circle) 80 mg l−1 and (diamond) 500 mg l−1 of d-sphingosine in DMSO over a 24-h period. Error bars denote standard deviations. Statistical significance with respect to controls is established using a one-way ANOVA. (Online version in colour.)
