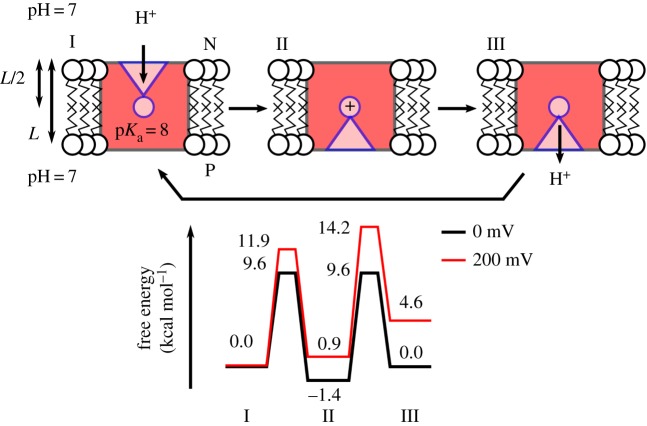
Figure 3.
Principles for constructing free-energy diagrams for proton transfer across the membrane. The free energies are related to equilibrium constants and rates by equations (7.1)–(7.3), and the effect of a membrane potential is estimated from equation (7.4). The figure shows transfer of a proton to a single group with pKa = 8 across the membrane from pH = 7 (N-side) to pH = 7 (P-side) without and with an external pmf of 200 mV. The model assumes that the proton transfer from the N-side and P-side to the buried proton loading site takes place on 1 µs timescales. The figure shows a passive proton channel, whereas a proton pump would operate with an element that modulates the pKa of the buried site by e.g. an electron transfer site [140].

