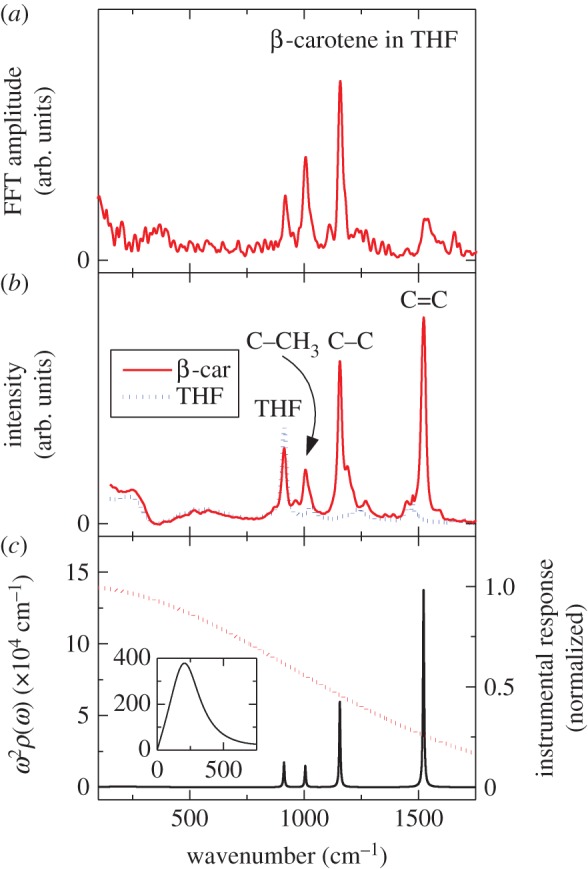
Figure 10.

(a) Fourier-transformed spectrum of the coherent signal component shown in figure 9b. (b) Raman spectra of β-carotene and solvent THF (tetrahydrofuran). (c) Spectral density (solid line) and the response function of the detecting system (dotted line). The inset shows the spectral density that reflects the system–bath (β-carotene and solvent THF) interaction in the low-frequency regime.
