
Figure 11.
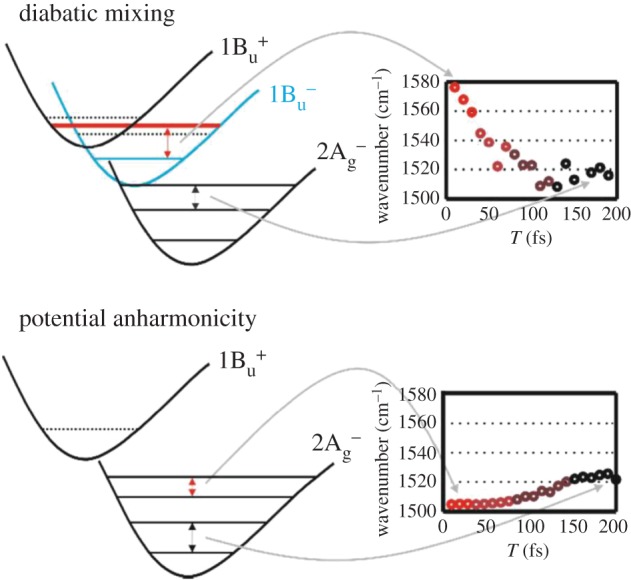
Scheme of vibrational frequencies shifts within the initial 200 fs dynamics. Diabatic mixing between 1Bu+ and 1Bu– leads to a frequency downshift during the evolution from the 1Bu+/1Bu– mixed potential to the 2Ag– potential. The red line in the 1Bu+/1Bu– mixed potential depicts the shifted vibrational level due to the diabatic mixing. Frequency upshifts due to the 2Ag– potential anharmonicity can be observed in the initial dynamics when diabatic mixing does not play a role. The intermediate states in the scheme for describing potential anharmonicity were omitted for clarity. (Reproduced with permission from [154].)