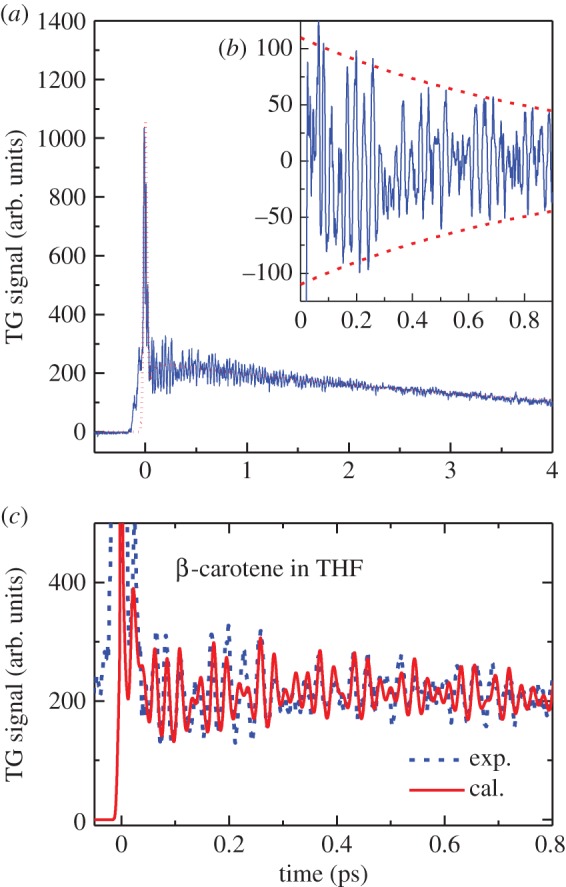
Figure 9.

(a) Experimentally observed time evolution of the transient-grating (TG) signal. A slowly varying background shown with dotted lines reflects the lifetime of the electronic excited states. If the background is subtracted from the original TG signal, the coherent vibration component can be extracted as shown in (b). The decay time of coherent vibration is determined to be around 1 ps. (c) Comparison of the experimentally observed TG signal (broken line) and the result of theoretical calculation (solid line).
