-
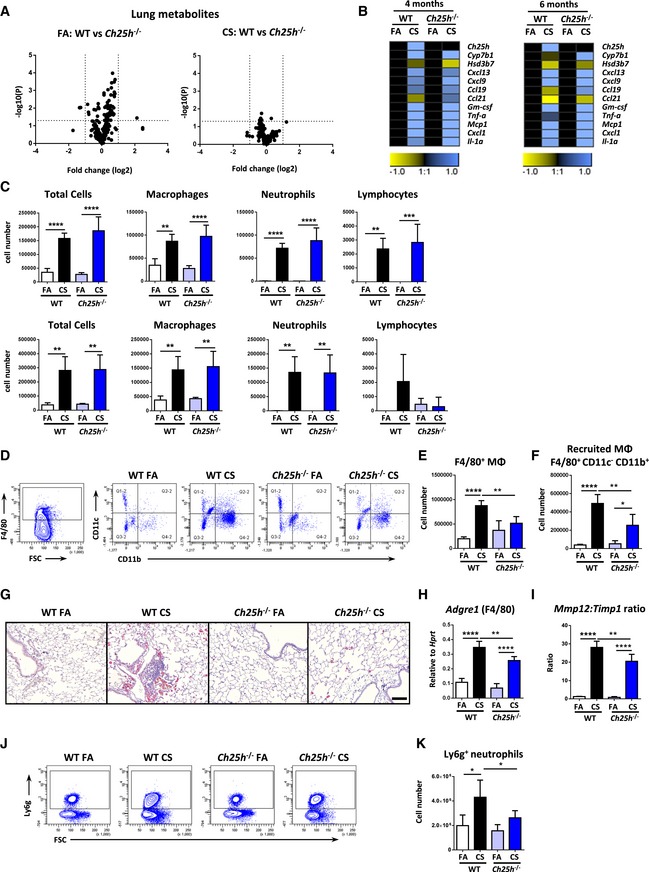
A
Volcano plots of the mean log2(relative fold change) versus –log10(P‐value) for each individual metabolite in whole lung tissue as determined by the AbsoluteIDQTM p180 Kit from wild‐type (WT) versus Ch25h
−/− mice. Left: 4‐month filtered air (FA) exposure (n = 4 mice/group). Right: 4‐month cigarette smoke (CS) exposure (n = 6 mice/group).
-
B
Heat map of mRNA abundance of the genes shown relative to Hprt1 and FA controls as determined by RT–qPCR from the lungs of WT and Ch25h
−/− mice exposed to FA or CS for 4 and 6 months. Data are representative of two independent experiments with four mice per FA group or six mice per CS group.
-
C
Bronchoalveolar lavage fluid total and differential cell counts from the mice described in (B). Upper panels 4 months and lower panels 6 months. Total cells: ****P < 0.0001, **P = 0.0023 (FA vs. CS, WT mice, 6 m) **P = 0.0014 (FA vs. CS, Ch25h
−/− mice, 6 m). Macrophages: ****P < 0.0001, **P = 0.0015 (FA vs. CS, WT mice, 4 m), **P = 0.0077 (FA vs. CS, WT mice, 6 m), and **P = 0.0034 (FA vs. CS, Ch25h
−/− mice, 6 m). Neutrophils: ****P < 0.0001, **P = 0.0039 (FA vs. CS, WT mice, 6 m), **P = 0.0029 (FA vs. CS, Ch25h
−/− mice, 6 m). Lymphocytes: **P = 0.0026 and ***P = 0.0005.
-
D–F
Flow cytometric analysis of whole lung single‐cell suspensions gated on CD45+ cells from post‐lavaged WT and Ch25h
−/− mice exposed to FA or CS for 4 months, to detect F4/80+ cells (E) and CD11c− CD11b+ F4/80+ recruited macrophages (MΦ) (F). F4/80+ cells: **P = 0.0039 and ****P < 0.0001. Recruited macrophages: *P = 0.0126, **P = 0.0034 and ****P < 0.0001. Data are representative of one experiment with four mice per FA group or six mice per CS group.
-
G
Representative immunohistochemical analysis of wild‐type (WT) and CH25H‐deficient (Ch25h
−/−) mice exposed to filtered air (FA) or cigarette smoke (CS) for 4 months, stained to detect galectin‐3 (red) and hematoxylin counter stained. Four mice per group. Scale bar, 100 μm.
-
H
Adgre1 (F4/80 gene) mRNA abundance in total lung homogenate from WT and Ch25h
−/− mice exposed to FA or CS for 4 months. **P = 0.0045 and ****P < 0.0001. Data are representative of two independent experiments with four mice per FA group or six mice per CS group.
-
I
Mmp12 and Timp1 mRNA abundance presented as a ratio in total lung homogenate from WT and Ch25h
−/− mice exposed to FA or CS for 4 months. **P = 0.0076 and ****P < 0.0001. Data are representative of two independent experiments with four mice per FA group or six mice per CS group.
-
J, K
Flow cytometric analysis of whole lung single‐cell suspensions gated on CD45+ cells from post‐lavaged WT and Ch25h
−/− mice exposed to FA or CS for 4 months, to detect Ly6 g+ neutrophils. *P = 0.0106 (FA vs. CS, WT mice) and *P = 0.0418 (CS WT vs. CS Ch25h
−/− mice). Data are representative of one experiment with four mice per FA group or six mice per CS group.
Data information: Data are mean ± SD.
‐values determined by one‐way ANOVA and Tukey's multiple comparisons test.