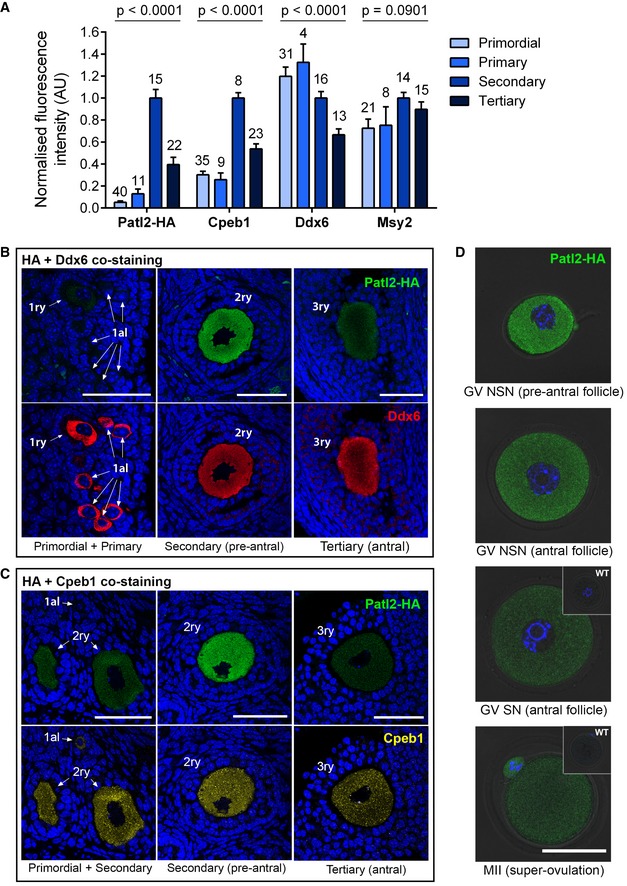
Ovary sections (3 μm thick) from Patl2‐HA homozygous mice were co‐stained with antibodies against the HA tag and either Cpeb1, Ddx6 or Msy2. Normalised mean fluorescence intensity at different follicle stages (as indicated) was measured using confocal microscopy. The mean fluorescence intensity of secondary follicle oocytes was used to normalise intensities for each protein to take into account variations in overall staining intensity between slides and obtain comparable values. Numbers above bars correspond to the size of the sample. Data are presented as mean ± SEM. Statistical differences were determined based on ANOVA test, P‐value as indicated.
Variation in fluorescence intensity for Patl2 and Ddx6 during oocyte growth. Confocal images obtained from the same section of an ovary from a Patl2‐HA female, co‐stained with antibodies against HA tag and Ddx6. Patl2 staining is not detectable in primordial oocytes, barely detectable in primary oocytes, and has a maximum intensity in secondary oocytes. Note that Ddx6 staining is strong in primordial oocytes. Primordial (1al), primary (1ry), secondary (2ry) follicles are indicated. Sections were counterstained with Hoechst to reveal the nucleus. Scale bar = 50 μm.
Variation in fluorescence intensity for Patl2 and Ddx6 during oocyte growth. Confocal images obtained from the same section of an ovary from a Patl2‐HA female, co‐stained with antibodies against HA tag and Cpeb1. Note that Cpeb1 is detectable in primordial oocytes and that its staining is more punctiform than Patl2 staining, with numerous foci observable at all stages. Primordial (1al), primary (1ry), secondary (2ry) follicles are indicated. Sections were counterstained with Hoechst to reveal the nucleus. Scale bar = 50 μm.
Comparative Patl2 staining of GV oocytes from pre‐antral, antral with NSN (non‐surrounded nucleolus) chromatin, antral with SN (surrounded nucleolus) chromatin and MII oocytes from Patl2‐HA‐tagged mice. GV oocytes were isolated by ovarian puncture, and MII oocytes were collected in the oviduct from stimulated Patl2‐HA females. After fixation, oocytes were stained with anti‐HA antibody and observed by confocal microscopy. In GV SN and MII oocytes, insets correspond to WT oocytes at the same developmental stage, showing no fluorescent staining. Scale bar = 50 μm.

