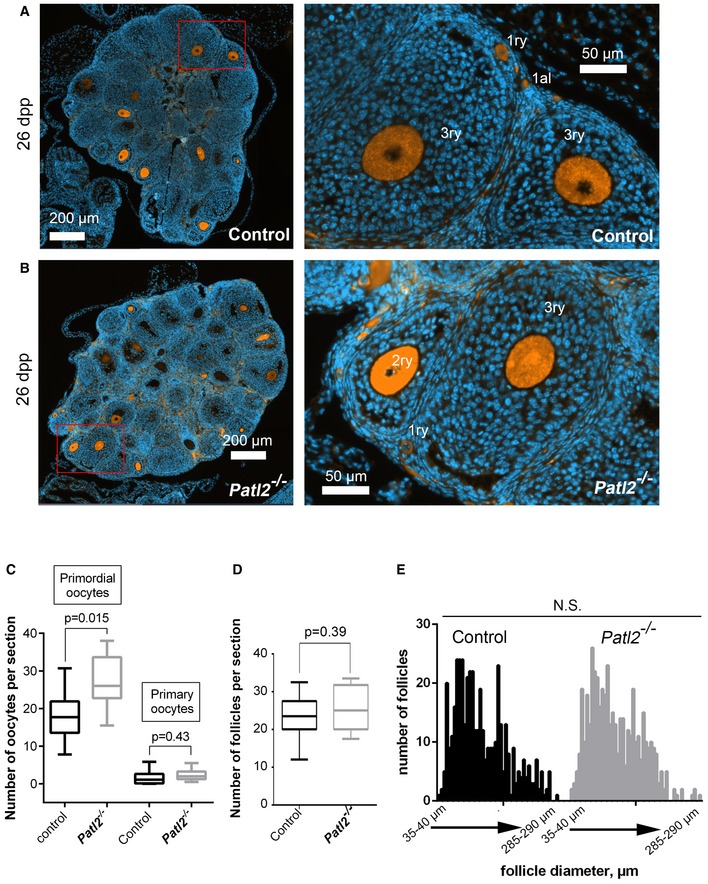
Figure EV2. Histological analysis of ovaries from control and Patl2 −/− females at 26 days postpartum (dpp).

- Whole section (3 μm thick) of an ovary from a control female at 26 ddp. Section was stained with an antibody against Msy2 (orange staining) to make oocytes clearly visible. Sections were counterstained with Hoechst to reveal the nucleus (blue staining). Right image, corresponding to the enlargement of the red square on the left image, shows the different classes of follicle: primordial (1al), primary (1ry) and secondary (2ry).
- Similar images for an ovary from a Patl2 −/− female at 26 ddp.
- Comparative numbers of primordial and primary follicle oocytes per section in Patl2 −/− and control ovaries. Nine different 3‐μm sections from three different mice (for each section, four‐seven technical replicates corresponding to successive sections were counted). Data are presented on box and whisker plots indicating min. and max. values. Statistical differences were assessed using t‐test, P‐value as indicated.
- Comparative number of follicles per section from control and Patl2 −/− ovaries. Only follicles where oocytes were visible were counted (n = 9 sections per genotype, between four to seven technical replicates). Data are presented on box and whisker plots indicating min. and max. values. Statistical differences were assessed using t‐test, P‐value as indicated.
- Comparative amplitude histograms of follicle size per section from control and Patl2 −/− ovaries (n = 9 sections per genotype with four to seven technical replicates). Statistical differences were assessed using Kolmogorov‐Smirnov test.
