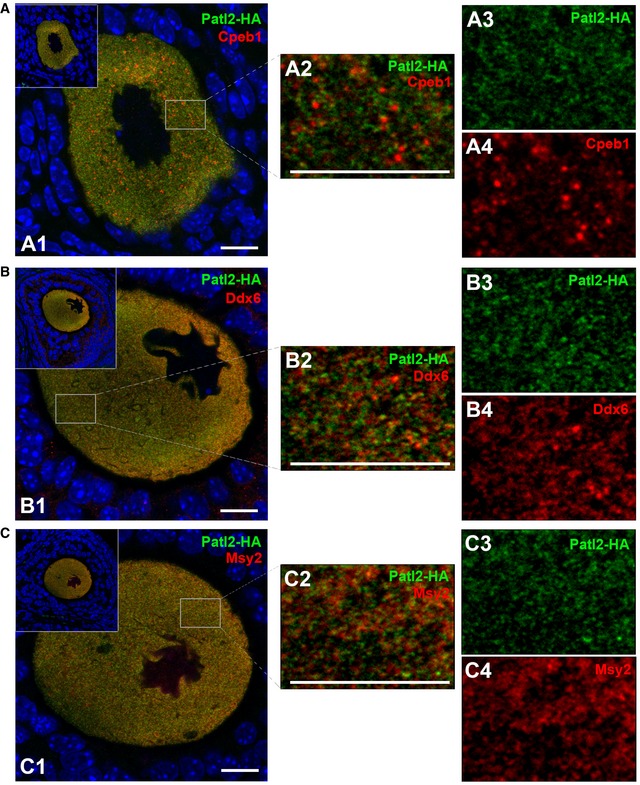
Figure 3. Analysis of possible colocalisation of Patl2 with Cpeb1, Ddx6 and Msy2.

- Confocal image of secondary follicle oocytes from Patl2‐HA homozygous females co‐stained with antibodies against HA tag (green) and Cpeb1 (red) and counterstained with Hoechst to reveal the nucleus (A1). Insets show the follicular environment of the oocyte studied. White rectangles indicate the zones of enlargement, shown on the right (A2). This image corresponds to a merge of Patl2 (A3) and Cpeb1 (A4) signals. Scale bars = 10 μm.
- Similar experiments performed with secondary follicle oocytes from Patl2‐HA homozygous females co‐stained with antibodies against HA tag (green) and Ddx6 (red). Scale bars = 10 μm.
- Similar experiments performed with secondary follicle oocytes from Patl2‐HA homozygous females co‐stained with antibodies against HA tag (green) and Msy2 (red). Scale bars = 10 μm.
