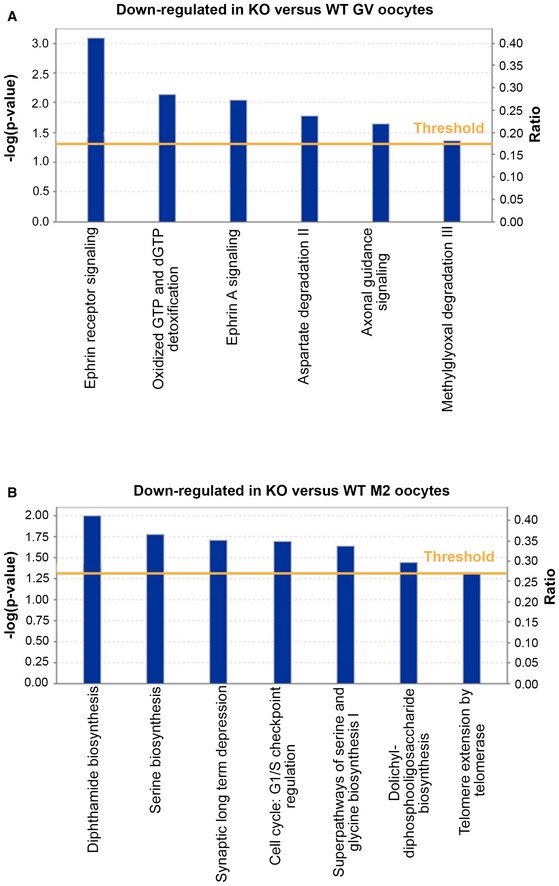
To investigate possible interactions of up and down‐regulated transcripts (
P < 0.05, absolute fold‐change > 2), genes with altered expression profile identified by the Affymetrix microarray were imported into the Ingenuity Pathway Analysis software (IPA) for analysis.
Canonical pathways identified by IPA that were significantly enriched among transcripts deregulated in Patl2
−/− GV oocytes with respect to GV‐WT oocytes.
Canonical pathways identified by IPA that were significantly enriched among transcripts deregulated in Patl2
−/− MII oocytes with respect to MII‐WT oocytes.
Data information:
Y‐axis indicates the significance (−log
P‐value) of the functional pathway association, which depends on the number of genes in a class as well as biological relevance. The threshold line represents a
P‐value of 0.05 and was calculated by applying Fischer's test.

