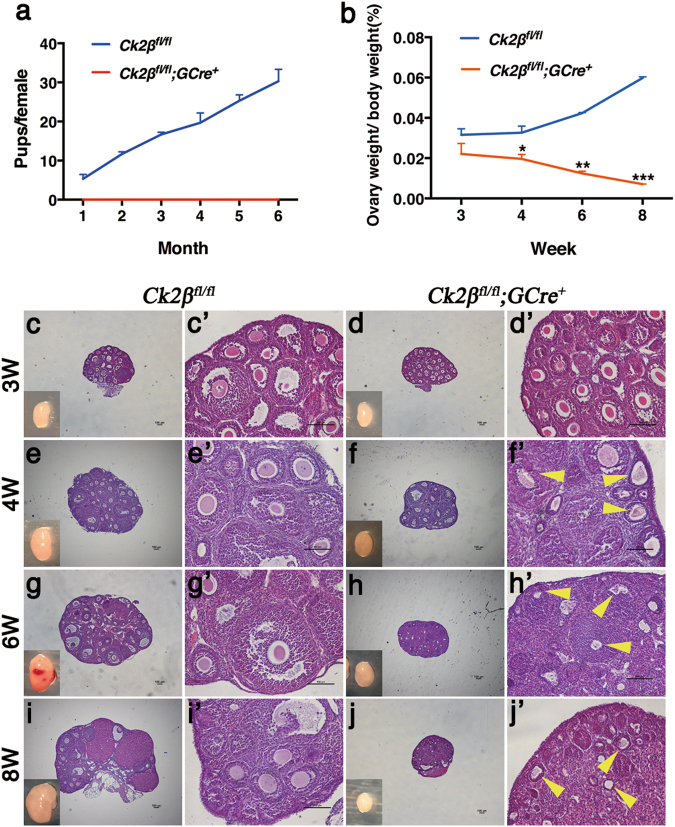
Fig. 2. Infertility and follicle atresia in Ck2βfl/fl;GCre+ mice.
a Comparison of the accumulative number of pups per Ck2βfl/fl female and Ck2βfl/fl;GCre+ female for 6 months. At least five mice of each genotype were used in this assay. b Ovary weight to body weight ratio of Ck2βfl/fl and Ck2βfl/fl;GCre+ mice at 3, 4, 6, and 8 weeks of age after birth. For each time point, at least three mice of each genotype were used for analysis. Data are presented as the mean ± SEM. P < 0.05(*), 0.01(**) or 0.001(***). c–j Representative ovarian histology of Ck2βfl/fl and Ck2βfl/fl;GCre+ mice of 3, 4, 6, and 8 weeks of age, respectively. Images c’–j’ correspond to the partial magnification of images c–j. Yellow arrowheads in f’, h’, and j’ indicate atretic follicles. For each time point, at least three mice of each genotype were used for analysis. Scale bar: 100 μm

