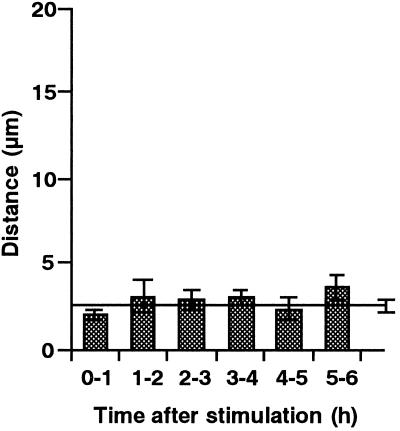
Figure 10.
Time course of nuclear movement after mechanical stimulation. After stimulation in the nuclear regions of protonemata, distances over which nuclei moved were measured hourly for 0 to 6 h after stimulation. Each bar represents the mean ± se obtained from seven protonemata. Control data from unstimulated cells are presented as a line with a se bar (n = 7).

