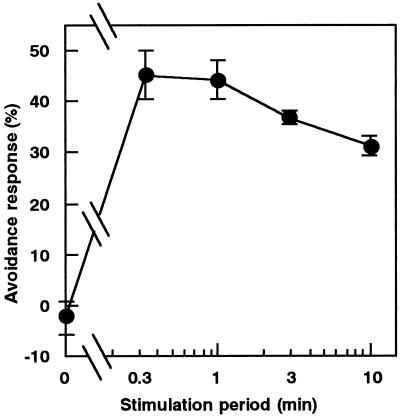
Figure 2.
Relationship between stimulation periods and the chloroplast avoidance response. Protonemata were pushed for various periods from above with a microcapillary. The avoidance response was assessed 2 h after the stimulation. See Methods for quantification of the response. Each point represents the mean ± se obtained from five to 10 protonemata.

