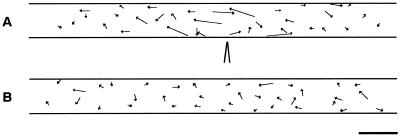
Figure 6.
Tracking of chloroplast movement during the avoidance response. Start and stop positions of chloroplast tracks made over 1 h after a 1-min mechanical stimulation are linked by arrows (A). Movement of chloroplasts in the control cell without the stimulation are also presented (B). The diagram of needle tip indicates the site of the stimulation. The protonemal tip is on the right. Bar = 20 μm.

